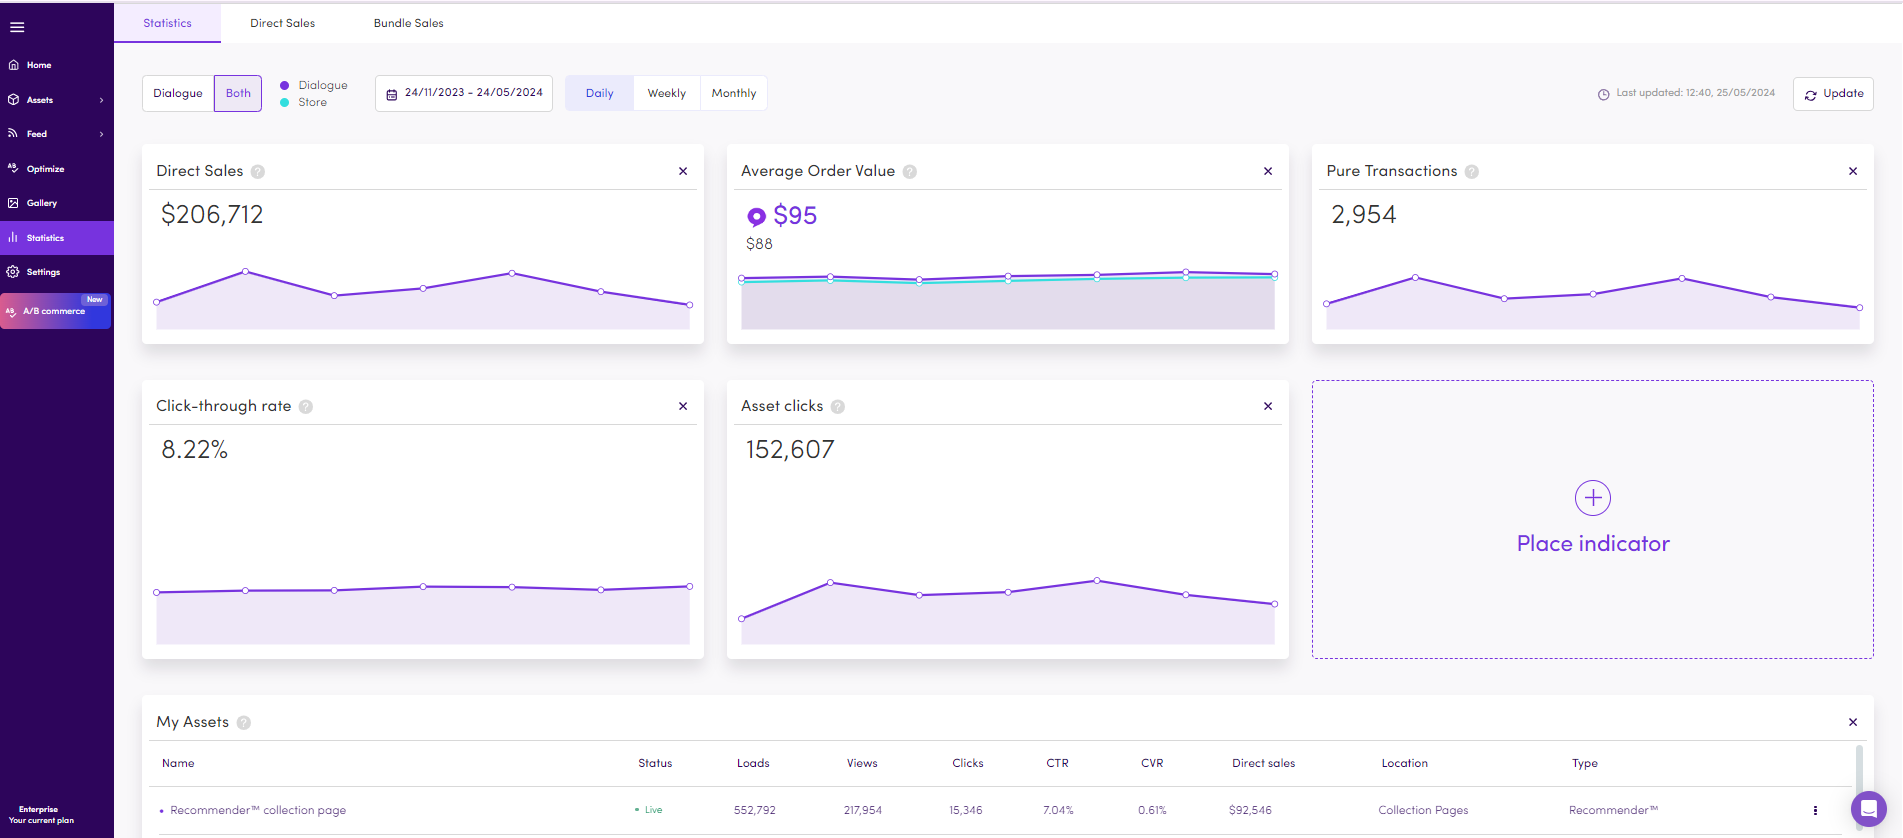
The Dialogue Dashboard provides an easy-to-understand overview of your performance metrics, your assets' performance, top-selling products sold by dialogue assets, Dialogue direct sales and bundle data. Through the dashboard, you'll be able to track your progress over time, compare the performance of your different assets, and get insights into how Dialogue is performing on your website.
Highlights
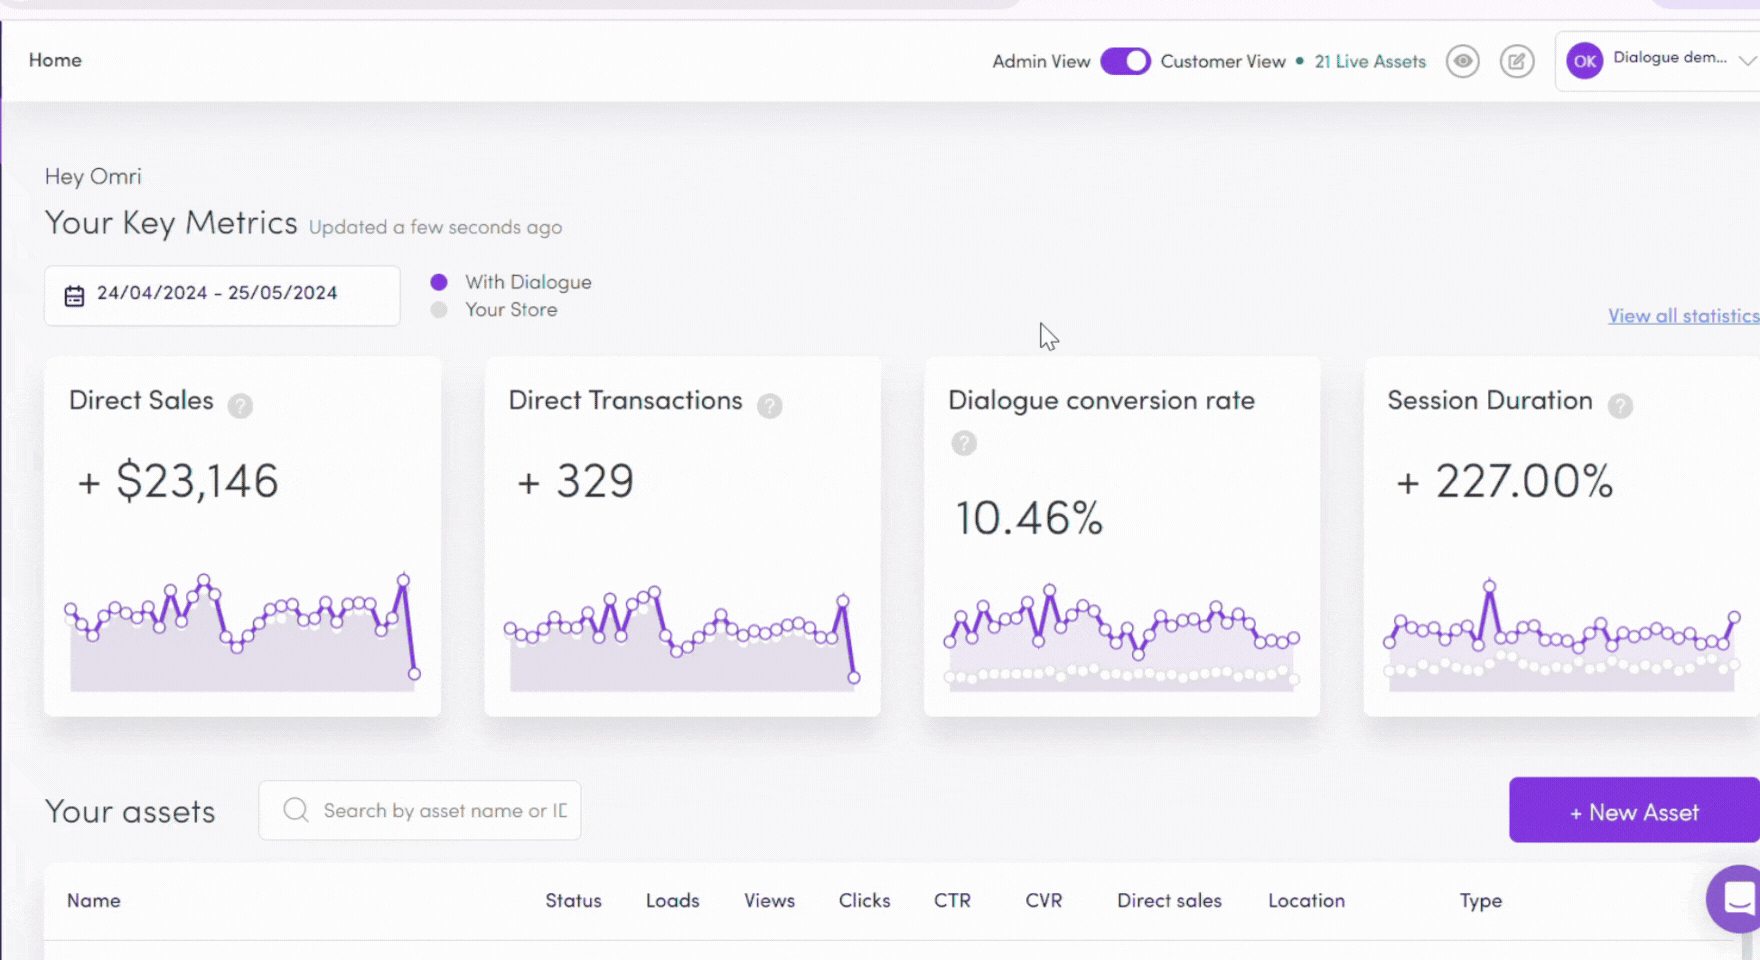
View & track your store's overall KPIs like conversion rates, AOV and CTR amongst many others.
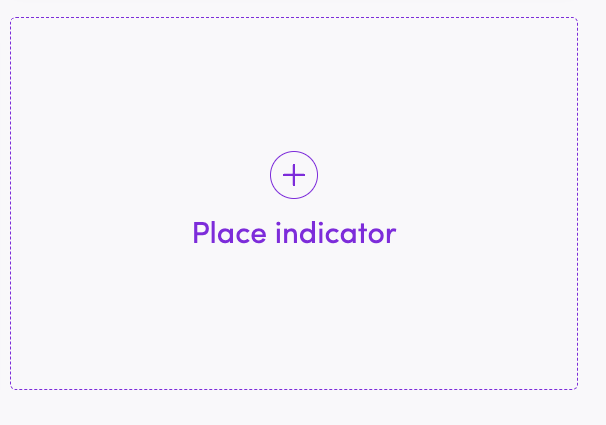
Add and remove indicators.
Alternate between daily, weekly or monthly view according to select dates.
Asset prioritized view according to lowest or highest performing on sales, CVR, CTR, loads, views & clicks etc.
View of your Top Selling Products by your categories or by asset.
View Dialogue's performance on it's own or in comparison to your store's performance.
Learn All About Dialogue's KPIs, Metrics & Statistics
Highlights

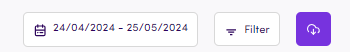
Filter sales based on specific dates or based on a specific asset.
Track Dialogue's Direct sales as a percentage of your total store sales.
Total transactions
Total products sold
Search by SKU
A detailed list of all of the products that were sold directly by Dialogue.
Specific details per product: Transaction time, Asset name, Order number, Quantity & Revenue amongst others.
Export Data
Highlights
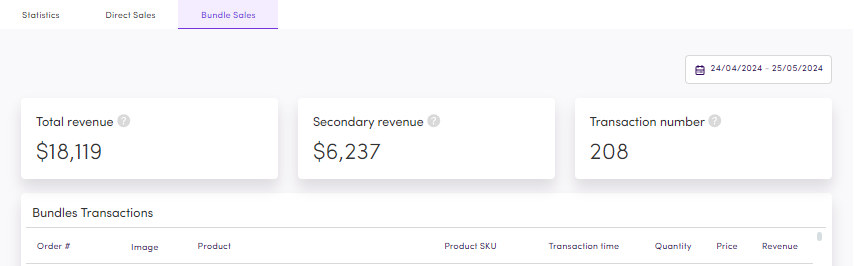
Once you start selling bundles, you'll have data about the bundled transactions.
Total revenue from selling the main product
Secondary revenue from bundle add-ons
Transactions number
Separate views for
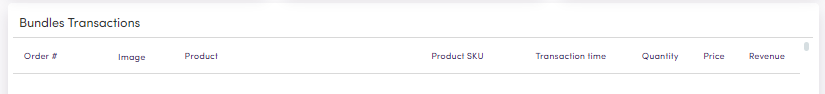
General Bundles Transactions
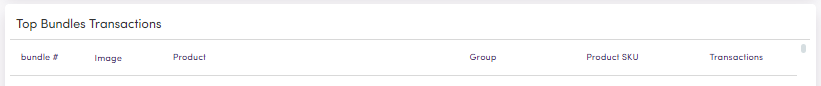
Top Bundles Transactions
Most Modified Bundles